The GNU Debugger, lovingly known as GDB, is an essential tool if you’re doing C/C++ development on Linux. It is installed on most Linux systems by default and is extremely useful in a variety of situations. It’s also a very difficult tool to use if you’re new to this kind of thing.
I’ve been using GDB for a year now, but I began as a wide-eyed Visual Studio user. I’ve made it to the other side but the memories of my manpage-filled journey are still fresh in my mind. This article is an attempt at documenting some of the useful things that GDB can do for you, written especially for people new to the Linux toolchain.
Table of contents
Before we begin
In order to do most things, GDB requires debug symbols to be present in the binary you’re attempting to debug. Use the -g option with GCC while compilation to include these debug symbols in your executable. e.g. gcc -g -o foo foo.c
Segmentation faults
This is likely the first thing you’ll end up needing, even before you want to step-debug your program. Say your program crashes with the classic segmentation fault (core dumped) error. Where is this supposed core dumped? Well, it usually isn’t dumped at all. Use the command ulimit -c unlimited on the terminal to set the core file size to unlimited, which tells the OS to dump everything it’s got.
Now if you run the program and the thing crashes, there will be a file called core in the current working directory. You can use this file to find out what went wrong. After you’ve got the core file, give it to GDB along with the executable’s name to start debugging: gdb ./foo core.
This will put you in debug mode in the stack frame where the segfault occurred. From here on, you can use the normal GDB workflow which is outlined in this article.
Loading an executable
If you’re not inspecting a core file, you usually want to start a program, set some breakpoints, and step through some code.
To start a program, use the command gdb ./foo (where foo, as is the convention in this article, is the name of the executable).
The TUI
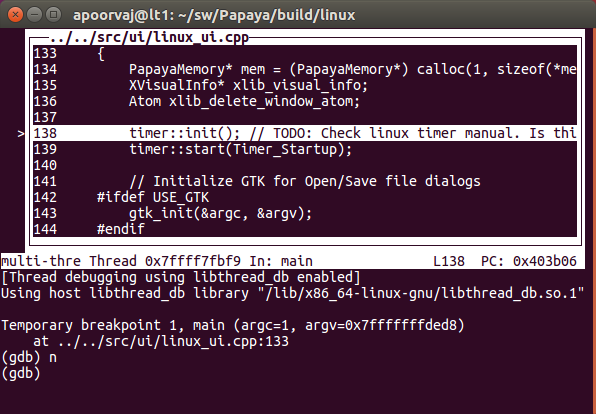
Before we start actual debugging, you’ll want to switch away from this empty GDB view, into something that is a tad friendlier. In classic GDB fashion, the most useful view is hidden away behind a magic incantation. Press Ctrl + x, a while in the gdb terminal. You should now be in the confusingly-named TUI (Text User Interface).
Advanced tip: You’ll be spending a lot of your time in this mode. If you want to start GDB in this mode by default, you may want to add an alias gdb="gdb --tui" to your .bashrc file.
While in the TUI mode, you will see the source code on the top half of the terminal and the command window on the bottom half. The up/down arrows scroll through the code instead of scrolling through the terminal command history, but you can use Ctrl + p or Ctrl + n for the command history.
If your program prints anything at any point, the TUI will get all garbled. Don’t panic: Ctrl + l will clean that up.
Basic commands
Breakpoints and control flow
| Command | Description |
|---|---|
start | Take a first step into the program |
step / s | Step into the current instruction |
next / n | Step over the current instruction |
finish | Step out of the current function |
b [line] | Set breakpoint at given line in current file |
b [file]:[line] | Set breakpoint at given line in given file |
b [func] | Set breakpoint at start of given function |
delete | Clear all breakpoints |
run / r | Run the program if not already running |
continue / c | Continue until breakpoint is hit |
kill / k | Kill program but don’t quit GDB |
quit / q | Kill the program if running and quit GDB |
| (Enter key) | Repeat the last command |
Printing variables
ptype [var] | Print type info of the given variable |
print [var] | Print value of the given variable |
print *[var] | Print the dereferenced value of the variable |
info args | Print function arguments |
info locals | Print local variables |
The call stack
bt | Print full call stack |
up | Move up the call stack |
down | Move down the call stack |
frame [num] | Move to the given stack frame |
Moving to a stack frame takes you to that point in the code if you’re in TUI mode. Additionally, now all the info locals and info params will print out the stuff relevant to the this stack frame.
Advanced break commands
Watchpoints
Using watchpoints, you can trigger a break in execution whenever the value of an expression changes. You do do this using the command: watch [expr]. You’ll usually want to put the name of a variable in the expression.
This can be useful when debugging large, unfamiliar code bases where you are only interested in specific variables changing in the course of execution.
Catchpoints
Catchpoints allow you to break execution on exceptions, or more importantly, syscalls. This is very powerful when combined with the strace tool.
You can catch a syscall using: catch syscall [syscall].
For instance, catch syscall open will break any time your program initiates an open syscall.
Multithreading
Threads
info threads | Print threads |
thread [num] | Move to the given thread |
Switching threads works similarly to moving stack frames.
Debugging deadlocks
Debugging deadlocks can be a tricky matter, especially if you’re dealing with a lot of complex multithreading. If a thread is permanently waiting on a mutex, you can find the thread that’s holding the mutex by doing the following:
- Navigate to the thread and stack frame that’s waiting on the mutex. You can navigate to this frame using the info threads, thread
[num],bt, andframe [num]commands. - Now you can print the thread ID of the mutex’s owner using the gdb command
print mutex.__data.__owner.
You can now go to that thread and figure out why it is not releasing the mutex properly.
Processes
If your application modifies process behavior, you may want some advanced GDB features to debug these.
In Linux, there are two main process-related syscalls - fork and exec.
The following commands can be used to tell GDB which process to follow after the new process is spawned:
set follow-fork-mode [child / parent] : By default, GDB will follow the parent. If you set it to follow the child, GDB will do so once the child has been forked.
set follow-exec-mode [new / same] : By default, GDB will replace the current process with the new process to be exec’ed. You can change this by switching to the new mode, in which a new process is created, which GDB then follows.
Attach
Speaking of processes, you may not always want to start debugging your program from the get go. In this case, you can also attach GDB to a process that is already running. In the terminal, before starting GDB, you can use the command ps -a to list running processes and their IDs.
You can then start GDB and attach to your target using the command: attach [process_id].
Depending on your configuration, you may have to start GDB as the root user (using sudo gdb) in order to do this.
Disassembly
GDB offers some really handy functions to view the disassembly.
layout split switches to a TUI view where you can see three panes - the command pane, the original source, and the disassembly. The disassembly and the source are correlated, so when you scroll using the up/down arrows, both panes scroll in coordination with each other.
Source to assembly
info line prints out the address range of the current line of source.
info line [func] prints out the address range of the given function.
Assembly to source
info line *0xffff prints out the source line and file where the given assembly address maps to.
You can use these as an interactive way to navigate through assembly. This is friendlier than searching through raw disassembler output.
Reverse
GDB can also remember execution steps and then interactively rewind through time. While this is extremely useful, when activated, this slows down execution and generates a lot of extra data in memory. Use the following GDB commands to control reverse debugging.
record | Start recording each instruction step |
record stop | Stop recording |
rn | Similar to the n command, but in reverse |
rs | Similar to the s command, but in reverse |
In my experience, reverse debugging doesn’t always work reliably, but is quite useful for short pieces of code.
Custom source path
Source files may not be available in the same path as embedded in the ELF. This can happen for any number of reasons, but most commonly when the machine you’re running on isn’t the one you built the code on. If this happens, you can substitute the original path with the new path using: set substitute-path [original_path] [new_path]
Dynamic loading
If you are dynamically loading a shared object file (.so), GDB may not recognize the files or functions you want to break on. It’ll thus ask whether you want to set a breakpoint on a future library load, and you’ll have to say yes.
This may get tiring after a while, so you can just use the following command to tell GDB to always allow this: set breakpoint pending on
If you’re wondering why typing this lengthy string is better than just occasionally saying yes in a terminal dialog, this is where the .gdbinit file comes in.
.gdbinit
As you can see, GDB has a lot of commands. Typing these in repeatedly can become cumbersome. Sometimes you can’t just kill the program and run it without quitting GDB, e.g. when forking is involved.
A good way of handling this is to create a ~/.gdbinit file. GDB reads this file and executes the instructions in it after startup. You can write commands in here that you may find yourself otherwise repeating, in order to reduce the tedium.
For example, the following .gdbinit file runs our program foo with dummy command-line arguments, sets up a few gdb variables, and breaks at a certain point.
    set breakpoint pending on # Disables that pesky dialog

    file foo          # Equivalent to saying "gdb ./foo"
    set args --dummy1 # Set foo's arguments, if any

    b some_function # Set a breakpoint

    # b 42  # Commented-out breakpoint. This file can be
            # quickly edited to avoid remembering all the
            # points of interest.

    r       # Run the program
And now if you just type in “gdb” into the terminal, gdb will start, open the “foo” program, set the breakpoint, run the program with any given arguments, and will wait.
Handy, eh?
History
If you want to retain command history across GDB sessions, you can add the following to your .gdbinit file:
    set history filename ~/.gdb_history
    set history save on
    set history size 10000